DA Analytics 1.1
DA Analytics - a look behind the scenes
As a developer you are using thePTV Drive&Arrive API with requests and responses in JSON format.
PTV DA Analytics is helping you getting insights via a graphical user interface. It gives you information about the requests you have send to PTV Drive&Arrive API, the quality of your data and the results, the estimated time of arrival (ETA) calculated based on your data.
DA Analytics is running under Chrome, Firefox or Edge, do not use Internet Explorer!
Parameters
There are useful parameters to use DA Analytics with
token=<Token> ...if you don't want to enter the token manually on the login page
tour=<SCEMID> ... searches for the tour after the login automatically
showMapTimeline=<true/false> ...switches the timeline function in the map view on/off, Default is off
Examples:
https://dave-apps.cloud.ptvlogistics.com/da/?token=<token>&tour=<SCEMID> .... to open a tour with a link
https://dave-apps.cloud.ptvlogistics.com/da/?showMapTimeline=true ... to open DA Analytics with timeline functionality
Login
In order to use DAAnalytics you need only your token - acting as an access key to DAAnalytcs 1.1

After successful login, you get access to an overview about your trips we have calculated ETA for.
Trip overview
Trips you have send to Drive&Arrive will be visualized in "Trip Overview". You can get an easy overview about the state of these trips.
- Are the finished?
- Are the stop reached on-time?
- Are the stop reached in the foreseen order?
- How many (GPS)-positions PTV Drive&Arrive gets from you?
- What was the overall duration of these trips?
You can also filter trips by date or number of stops and positions (e.g. to see trips without any GPS-Positions)

- ETA OK - calculated ETA of all position is for all stops is in +/- 15 minutes
- On time - all stops are reached between earliestArrivalTime and latestDepartureTime
- Stop order - STOP_ARRIVED events order is as planned
- Geofence order - position events coordinates has reached stops in same order as planned
- Done - all stops were reached
- Duration - time between first and last position event
- Round trip - first stop is at same position as last stop
To get more detailed information's you can switch to Journal, Chart, Map or Stop-order view.
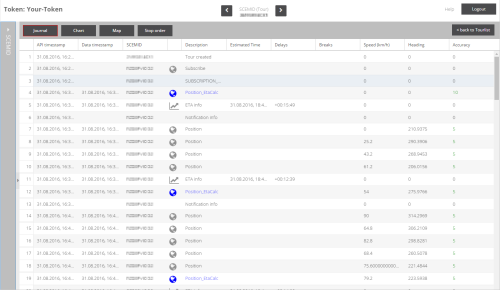
Journal
Developers can easily find out which requests are send to PTV Drive&Arrive API sorted by time-stamp and if they have the suitable parameters. They get also information's about which positions are used for ETA calculation and if PTV Drive&Arrive had data about delays from the current position to destination. Detected breaks are listed as well.
Chart
Every n minutes Drive&Arrive calculates an ETA for all remaining stops of the trip. For a trip of several hours and stops this makes a lot of data. This data can be visualized in a chart to see deviations easier.
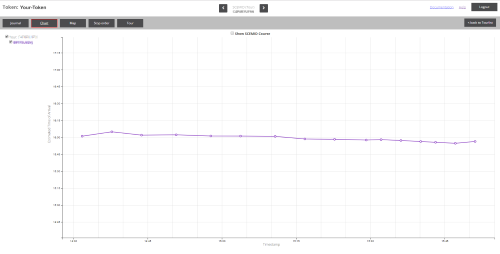
This chart visualize the ETA over the time, e.g. 12:28 the ETA was 13:17 and at 13:03 the ETA was 13:20 etc. it visualizes also the effective time of arrival (TA), the automatic determined time of arrival via Geo-fencing (ATA) and the planned time of arrival (PTA) as lines in different colors.
Map
Every position is visualized on a digital map. This permits verification of positions, e.g. are positions on the corresponding lane, are going positions to the specified destination etc.

Stop order
For every planned stop arrival-, departure- and service times are visualized. For reached stops the time of the received state is visualized and the time of the determined time of Drive&Arrive via Geo-fencing is shown. Planned stop order compared to stop order of execution is shown as well.

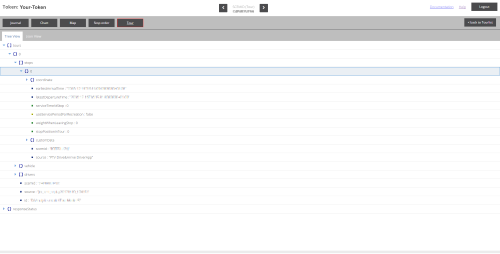
Tour
Tour details as tree or JSON will be displayed.
Accessing Drive& Arrive with parameters
To automate your processes you can use the following parameters
- token= specifies the predefined toke to use,
e.g. https://dave-apps.cloud.ptvlogistics.com/da/?token=<token> - token= and tour= specify the token, as well as a tour that sould be seared an loaded automatically
e.g.https://dave-apps.cloud.ptvlogistics.com/da/?token=<token>&tour=<tour-SCEMID> - showMapTimeline = shows in the map an interactive timeline at the left border
e.g. .https://dave-apps.cloud.ptvlogistics.com/da/index.html?showMapTimeline=true
respectively
http://172.23.112.117:7070/DAAnalytics/?token=PTV_jmeter_8PS6F868QDPW4I&tour=43QUZGN1PO
© 2025 PTV Logistics GmbH | Imprint